The Public Opinion Research Lab at the University of North Florida has released the results of a new poll looking at the governor’s race and U.S. Senate race in Florida. We’ll have a full story soon. In the meantime, here are the survey results:
If the election for Florida governor were being held today, how would you vote if the candidates were…
| Answer Options | Florida Likely Voters
|
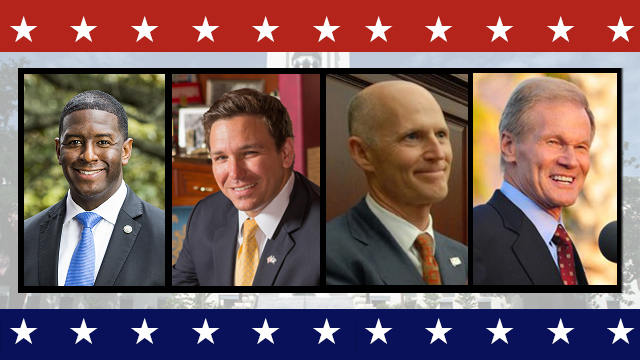
| Andrew Gillum, the Democrat | 47% |
| Ron DeSantis, the Republican | 43% |
| Someone Else | <1% |
| Don’t Know | 10% |
| Answer Options
|
Democratic Likely Voters | Republican Likely Voters | |||
| Andrew Gillum, the Democrat | 85% | 11% | |||
| Ron DeSantis, the Republican | 6% | 81% | |||
| Someone Else | 1% | – | |||
| Don’t Know | 9% | 8% |
If the 2018 election for U.S. Senator from Florida were being held today, how would you vote if the candidates were…
| Answer Options | Florida Likely Voters |
| Bill Nelson, the Democrat | 45% |
| Rick Scott, the Republican | 45% |
| Someone Else | 1% |
| Don’t Know | 9% |
| Answer Options
|
Democratic Likely Voters | Republican Likely Voters |
| Bill Nelson, the Democrat | 77% | 12% |
| Rick Scott, the Republican | 9% | 83% |
| Someone Else | <1% | 1% |
| Don’t Know | 13% | 4% |
Amendment 4 on the statewide ballot for 2018 is called “Voting Rights Restoration for Felons Initiative.” This Amendment would restore the voting rights of Floridians with felony convictions after they complete all terms of their sentence, including parole or probation. The amendment wouldn’t apply to those convicted of murder or sexual offenses. If the election were held today, would you vote “yes” or “no” for this proposition?
| Answer Options | Florida Likely Voters |
| Yes | 71% |
| No | 21% |
| Don’t Know | 8% |
| Answer Options
|
Democratic Likely Voters
n=239 |
Republican Likely Voters
n=259 |
| Yes | 83% | 62% |
| No | 10% | 31% |
| Don’t Know | 7% | 8% |
| Answer Options
|
White Likely Voters
n=423 |
Black Likely Voters
n=81 |
Hispanic Likely Voters
n=83 |
Other Race Likely Voters
n=30 |
| Yes | 69% | 82% | 65% | 83% |
| No | 23% | 11% | 28% | 7% |
| Don’t Know | 9% | 7% | 7% | 10% |
What do you think is the most important problem facing Florida today?
| Answer Options
|
Florida Likely Voters |
| Economy/Jobs/Unemployment | 10% |
| Education | 20% |
| Healthcare | 18% |
| Crime | 10% |
| Environment | 18% |
| Immigration | 13% |
| Terrorism | 2% |
| Gun Policy | 1% |
| Race Relations | <1% |
| Government/Politics | 2% |
| Something Else | 2% |
| Don’t Know | 3% |
Survey Demographics
| Party Registration | Florida Voters |
| Republican | 40.8% |
| Democrat | 39.5% |
| NPA and other | 19.7% |
| Age | Florida Voters |
| 18 to 24 | 8% |
| 25 to 34 | 10% |
| 35 to 44 | 12% |
| 45 to 55 | 16% |
| 56 to 64 | 20% |
| 65 and older | 35% |
| Race | Florida Likely Voters |
| White (not Hispanic) | 67% |
| Black (not Hispanic) | 14% |
| Hispanic | 14% |
| Other | 5% |
| Sex | Florida Likely Voters |
| Male | 45% |
| Female | 55% |
| Telephone | Florida Likely Voters |
| Landline | 32% |
| Cell phone | 67% |
| Don’t Know/Refusal | 1% |
What is the highest grade in school or year of college you have completed?
| Education | Florida Likely Voters
n=654 |
| Less than high school | 2% |
| High school graduate | 23% |
| Some college | 39% |
| College graduate | 21% |
| Post graduate degree | 14% |
| Don’t Know | <1% |
| Refusal | 1% |
What language was this survey completed in?
| Survey language completed in… | Florida Likely Voters
n=654 |
| English | 97% |
| Spanish | 3% |